Description
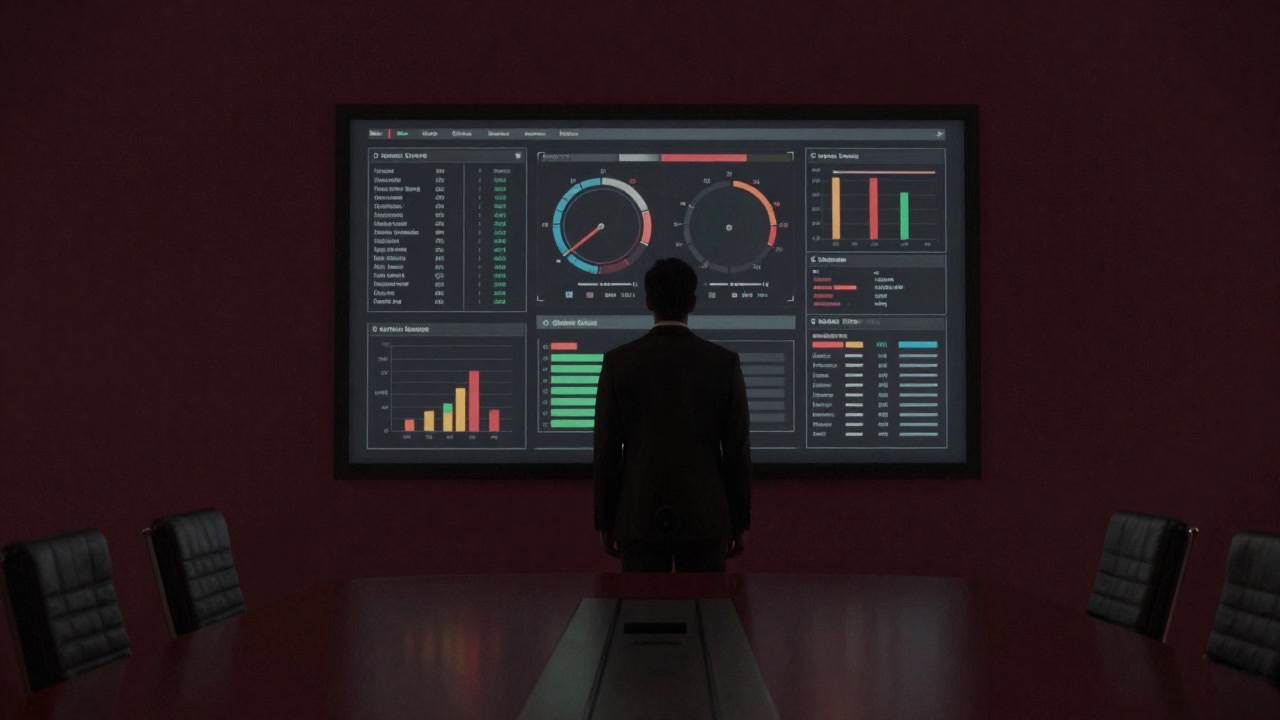
A dashboard is a stage adorned with colorful graphs and gauges that illuminate corporate performance while obscuring fragments of truth. It offers executives a false sense of security, even as a tightrope walk of numbers unfolds behind the scenes. At times it conjures the occult of forecasting, pretending to save those drowning in data while ensuring their demise. With each press of the refresh button, new confusion and illusion arise— a radiant altar of chaos.
Definitions
- A magical status board of illusion, lining executives with relief via colorful graphs and numbers.
- A device that paralyzes judgment by transforming numerical constraints into beautiful visuals.
- A monster enforcing an infinite refresh loop under the guise of ‘real-time’.
- A visual trickster that hides needed data while exaggerating overused figures.
- An alchemical cauldron turning leaden numbers shining gold, called KPI.
- A magic mirror that appears at meeting start, turning attendees into instant sages.
- A labyrinth of indecipherable widgets trapping explorers in exhaustion.
- A conductor of a duet that satisfies executives’ approval thirst while stoking staff anxiety.
- A manipulator of information, reconstructing truth conveniently with filters and slicers.
- A tool that rules the team through refresh-induced fear, scattering reassurance and chaos alike.
Examples
- “This dashboard is a showy mirror that only clouds the real decision-making.”
- “Revenue trends? Just a bunch of dancing pictures.”
- “Anyone know where the truth hides in this chart?”
- “You look at the dashboard for safety… only to be trapped in confusion.”
- “When the red line rises, heads roll—so I added a filter to hide it.”
- “Open the dashboard in a meeting and everyone suddenly looks smarter.”
- “KPIs are nothing more than a numbers-matching game.”
- “Chart accuracy? Just a placebo at best.”
- “Thanks to the dashboard, our unseen risks remain unseen.”
- “The execs believe only in pretty numbers—a propaganda machine.”
- “Weekly report? More like a colorful slide show.”
- “Predictive models? Like magic crystal balls.”
- “I heard the user guide for this dashboard is 40 pages long.”
- “On mobile, the text collapses and becomes lethal.”
- “Optimizing to hide truths is its specialty.”
- “We’re dancing to the sound of ‘real-time’—so catchy.”
- “Nobody masters it; it’s just self-satisfaction software.”
- “Auto-update: feature that auto-generates chaos.”
- “An artistic feast of reds, blues, and greens.”
- “If no conclusion emerges, just ask the dashboard.”
Narratives
- The lights dimmed in the boardroom, leaving only the dashboard’s cold glow. Its mechanical calm strangely reassured everyone.
- At month-end, analysts battle slicers and wrestle with filters until dawn. Their victory lies in a single dashboard screen.
- Before the dashboard, executives wear looks of omnipotence, though they can only press two buttons.
- Occasionally, missing data spawns bizarre peaks in charts—met with applause as if they were triumphs.
- New features are added to the dashboard, only to be rebranded ‘improvements’ and left untouched.
- A special workshop is held to teach color codes; most attendees forget them on the ride home.
- Dashboard warnings are frequently blamed on other departments. The truth remains unknown.
- The board ignores numbers, while the staff distrust them too much. Will this chasm ever close?
- Legend deciphering takes twenty minutes; decisions are made in ten seconds.
- Mastering the dashboard is a rite of passage and a badge of honor.
- When the dashboard blinks white from a system glitch, a hush falls over the floor—until panic erupts.
- Every morning, update notifications prompt the question, ‘What did they change this time?’
- A peak threshold triggers an alarm that tightens the audience’s stomachs.
- Screenshoting the dashboard becomes a stylish meeting deck cover.
- Non-engineers say ‘It looks simple’; engineers whisper ‘It’s hell behind the scenes.’
- Digging into historical data, you find nothing but ghosts of bugs lurking in old charts.
- Skipping a dashboard update yields a silent ‘out of my scope’ message.
- Too many widgets become weapons that shred the viewer’s focus.
- Those who parse dashboard logs are explorers drowning in seas of data.
- In the end, every decision is made on the dashboard’s error screen.
Related Terms
Aliases
- Number Magic Circle
- Executive Crystal Ball
- Vanity Panel
- Elixir of Reassurance
- Meeting Prey
- Data Haunted House
- Cloak of Metrics
- KPI Unicorn
- Graph Crown
- Curtain of Colors
- Inflating Widget
- Brainwash Screen
- Infinite Refresh Machine
- Doomsday Gauge
- Mirror of Self-Satisfaction
- Data Planter
- Decision Trap
- Ambiguity Filter
- Numeric Fireworks
- Prediction Deception Device
Synonyms
- Safety Dummy
- Glossy Contraption
- Color Scatterer
- False Graph
- Pseudo-Statistics
- Meeting Altar
- Visual Poison
- Frenzy Generator
- Maze of Light
- Data Illusion
- Executive Shelf
- Meaningless Feed
- Revenue Mirage
- Numerical Mirage
- Control Box
- Power Showcase
- Pictorial Trompe-l’œil
- Faith of Convenience
- Spot-the-Difference Board
- Illusion Control Panel
Use the share button below if you liked it.
It makes me smile, when I see it.