Description
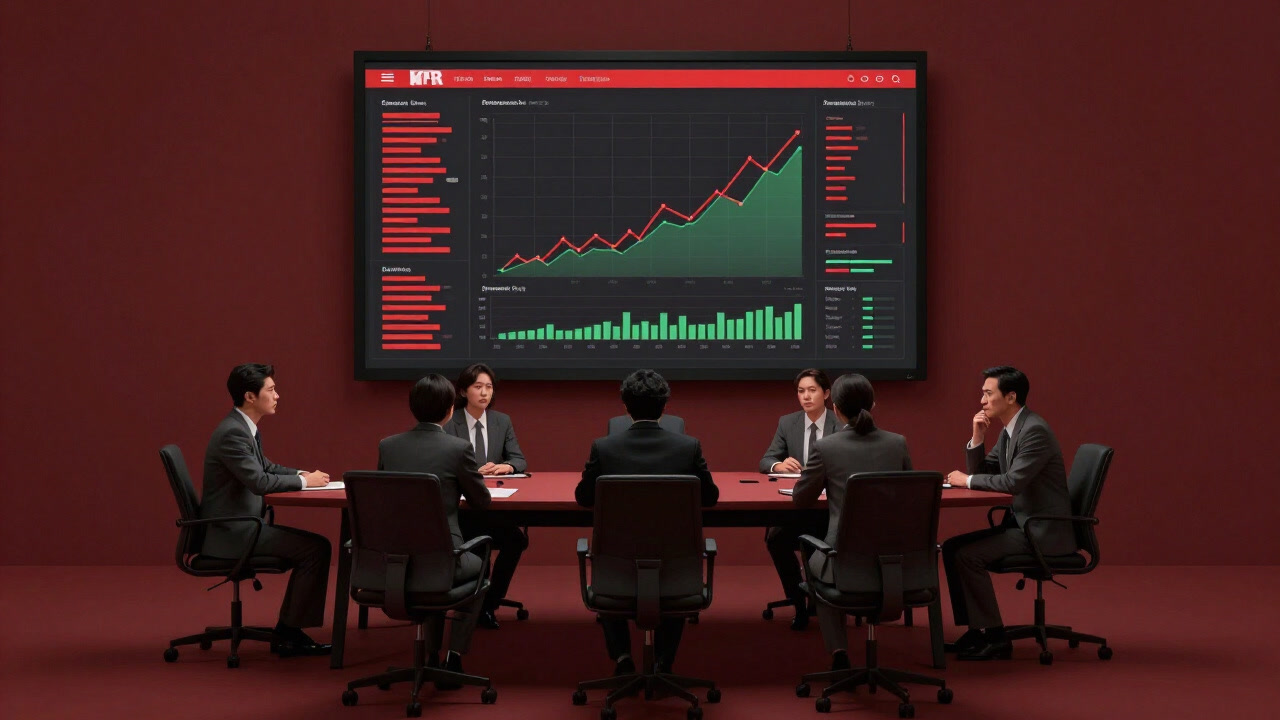
A KPI dashboard is like a sacred pane of glass that claims to show organizational goal attainment at a glance, but in reality it is a horror device that makes one want to avert their eyes from the sea of numbers. Decision-makers pretend to feel reassured as they stare at it, oblivious to the crumbling reality. When the lights turn red, they panic; when they turn green, they bask in relief and promptly point the blame elsewhere. The art of turning data into polished graphs is celebrated, while behind the scenes, the sorcery of imprecise figures silently governs the screen. Ultimately, the KPI dashboard is an indispensable ritual artifact that houses both the statue of hope and the idol of fear.
Definitions
- A KPI dashboard is a theatrical set designed to manufacture peace of mind for decision-makers.
- A KPI dashboard is a visual sleight of hand that repaints red deficits into green prosperity.
- A KPI dashboard is the prison of executives shackled by data.
- A KPI dashboard is a graphic sheet that conceals project corpses.
- A KPI dashboard is the magic mirror that summons applause at reporting meetings.
- A KPI dashboard is a carnival where numbers dance, yet whose finale no one knows.
- A KPI dashboard is a mystery cocktail mixing truth with hope.
- A KPI dashboard is the portrait gallery of figures adorning conference room walls.
- A KPI dashboard is the logbook of a voyage where one nearly drowns in seas of metrics.
- A KPI dashboard is a knockoff warranty for the future.
Examples
- “The KPI dashboard is red? That must be someone else’s fault.”
- “Behold this beautiful graph… though it’s utterly useless in reality.”
- “Boss: Did you check the KPI dashboard? Employee: Yes, I’m reassured… but clueless on what to do next.”
- “Missed Q2 goals? No problem, just change the color and no one notices.”
- “Set the time spent staring at the dashboard to 1.5x actual work hours.”
- “Project X completion? 100% on the dashboard… on the surface.”
- “KPI Dashboard: the ultimate tool to boast successes and bury failures.”
- “Data never lies, they say. Dashboards specialize in designing lies.”
- “Manager: Use this chart in the presentation!… but please remove only the red part from my sheet.”
- “Not meeting targets? No, we’ve simply phase-shifted to ‘In Pursuit.’”
- “Dashboard glowing red? My eyes are burning and my head is pounding.”
- “Morning ritual: coffee in one hand, red KPI alerts in the other.”
- “Every glance at the dashboard makes me feel puppeteered.”
- “KPI Dashboard: the app that oscillates between hope and despair.”
- “Numbers misaligned? That’s our new feature: Display Offset.”
- “KPI looking healthy today? No, we haven’t pasted it into PowerPoint yet.”
- “We employ a two-tongued strategy: ‘Show KPIs’ and ‘Hide KPIs.’”
- “If I spent less time staring at the dashboard, maybe performance would improve.”
- “Final trust goes to nothing but color saturation on the dashboard.”
- “Raised the target? Of course, but only on the dashboard.”
Narratives
- The morning KPI dashboard check is akin to a priest awaiting divine revelation.
- Faced with a screen of red indicators, everyone participates in a silent ritual.
- Only when the green bars multiply does applause echo through the boardroom.
- The dance of numbers is vibrant, yet anxiety and urgency lurk behind the scenes.
- The KPI dashboard is not just a reporting tool but a symbol of fear governance.
- In weekly reviews, a silent skirmish over colors unfolds.
- Those who forget to update the dashboard incur the wrath of their subordinates.
- When numbers fall short, someone miraculously downgrades the targets.
- The KPI dashboard stands out more for its laborious upkeep than actual performance.
- Green graphs bring serenity; red ones summon paranoia.
- Data may not lie, but reassembling it differently is deceptively simple.
- KPIs from unseen departments are treated as if they never existed.
- Scarlet figures etch fresh wrinkles into the boss’s brow.
- Believing a dashboard redesign will solve all problems is a monstrous delusion.
- The KPI dashboard is a cursed relic enshrined in the temple of corporate strategy.
- Data visualization has advanced, while decision-making has grown increasingly ambiguous.
- Metrics are served like exotic pastries, none knowing the proper way to consume them.
- Weekend overtime becomes the soundtrack to the ritual of silencing red alerts.
- When a graph segment disappears, meetings feel like banquets without food.
- Watching the KPI dashboard flicker is like staring into an oracle that offers no clear answers.
Related Terms
Aliases
- Goal Sentinel
- Number Dancer
- Performance Rack
- Graph Alchemist
- Red Lamp Overlord
- Green Signal Mirage
- Data Prison
- Indicator Clown
- KPI Labyrinth
- Visual Trickster
- Praise and Execution Stage
- Performance Theater
- Dashboard Temple
- Decision Compass
- Evaluation Blindfold
- Numeric Grail
- Meeting Clergy
- Report Jewel Box
- Enemy or Ally Grid
- Success Mirage
Synonyms
- Number Enthrallment
- Chromatic Ritual
- Performance Mirror
- Metric Shackles
- Data Feast
- Tally Lock
- Visible Policy
- Annoyance Chart
- Illusory Reassurance
- Management Toy
- Numerical Alchemy
- Meeting Ornament
- Judgment Foreshadow
- Report Antique
- Shape Fantasy
- Vainglory Surface
- Statistical Altar
- Paranoia Source
- Pseudo Progress
- Immortal Color Code
Use the share button below if you liked it.
It makes me smile, when I see it.